Simulation Menu
The Simulation menu is only available if Material Removal Simulation and/or Virtual Machine Simulation were selected in the Simulation launch panel settings (see “VM Tab”). More details on the Simulation menu functions can be found in the “Virtual Machine Users Guide”. The following simulation menu functions are available:
Main simulation viewing windows
Virtual controller functions
Simulation manager window
Camera, selection, measurement, MRS & gouge settings
Part (design & stock) and fixture definition
Tool & holder definitions / Head selection
Viewpoint manipulation
General object visibility
Measurement functions
Markup, video and snapshot functions
Physical component visibility
Physical component visibility
Physical component visibility
Grid settings
Lighting settings
Material definitions
Heads-Up Display settings
Disconnected in-process stock chip removal
In-process stock vs. part comparison
Other options
Load setup from another session
Save current session
Simulation»Virtual Machine
Enables the display of the individual Virtual Machine simulation windows if hidden or minimized, or hides them if already active. When Lock View Properties is set, changes to one window are applied to all; otherwise properties of each window can be individually controlled. The visibility of the simulation windows can be toggled from the View toolbar. Collision and over-travel detection are not affected in any way by the simulation window visibility state.
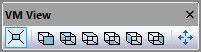
Simulation windows supports both Perspective and Orthogonal projection, selectable by the leftmost button in the VM View toolbar. The middle six buttons of the VM View toolbar orient the camera to face the Front, Back, Top, Bottom, Left and Right views of the machine. The camera can only be panned but not rotated while one of these standard views is selected. At the start of processing, standard views are with respect to the stock mount point, but this can be changed by selecting a different component (e.g., the machine origin) in the VM Grid toolbar or by attaching the camera to an object in the scene (more on grids and attaching the camera to components later). The rightmost button in the VM View toolbar adjusts the camera aim and zoom (in that order) to fit the currently selected object so that it is fully visible in the simulation window (if no object is selected, then the camera is adjusted so all objects can be seen). All of these toolbar functions are also available from the Simulation»Camera menu.
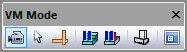
The three buttons on the left side of the VM Mode toolbar select the primary function of the left-mouse button (this can also be set from the Simulation»Mode menu). When in “Camera mode”, holding the left-mouse button down while moving the mouse changes the orientation of the camera. The cursor appears as a four-way arrow when in Camera mode. When in “Selection mode”, pressing the left-mouse button selects the object under the mouse pointer. The cursor appears as a simple arrow when in Selection mode. When in “Measurement mode”, pressing the left-mouse button either starts or completes a measurement function using the selected object under the mouse pointer. The cursor appears as an arrow with calipers when in Measurement mode.
When in Camera mode, press and hold the Ctrl key to temporarily switch to Selection mode. This can be used to quickly select objects to rotate about or to attach the camera to. When in Selection or Measurement mode, press and hold the Ctrl key to temporarily switch to Camera mode. This can be used to get a better view of the object you are trying to select or measure.
It is important to remember that with VM, you are moving (or flying) a camera through a three dimensional scene. Changing your viewpoint typically involves some combination of panning, rotation and roll.
Panning moves the camera up, down, left, right, as well as in and out of the scene. When in perspective mode, you can pan the camera through an object to see beyond it. When in orthogonal mode, panning in and out instead acts like a typical zoom lens.
Rotation changes where the camera is pointing, by angling it to the left, right, up or down (i.e., pitch and yaw). Camera rotation is similar to the actions of turning your head to the left or right and up or down. Camera rotation is only possible when a standard view (e.g., front, back) is not selected, since views lock out camera rotation.
Roll tilts the camera so that objects can be viewed from a different angle. Camera roll is similar to the action of tilting your head to the left or right.
The Simulation»Options dialog Misc tab has a Mouse Scheme setting that can be used to change the selection, pan, zoom and rotation functions described below, to those of popular CAM systems such as CATIA, NX, and Mastercam.
Camera panning:
The following is a list of panning navigation functions. Hold the Shift key while panning to reduce the distance the camera moves to 1/10th the normal amount. You can adjust the overall panning sensitivity by holding the Ctrl key and repeatedly pressing the + (plus) and – (minus) keys (also available from the Simulation»Camera»Speed menu bar):
Pan
Key
Mouse
Up
Page Up
Middle-mouse, move forward
Down
Page Down
Middle-mouse, move backward
Left
Left arrow
Middle-mouse, move left
Right
Right arrow
Middle-mouse, move right
In
Up arrow
Mouse wheel forward
Out
Down arrow
Mouse wheel backward
Camera rotation:
Move the mouse while holding down the left-mouse button to change the viewing direction of the camera. There are two types of camera rotation.
The default rotation is to keep the camera position fixed but to change where the camera is aimed. This is similar to how we rotate our head to look around a scene.
You can hold the Shift key to change how the camera rotates. When Shift is pressed, the camera rotates around a point in space. This rotation point is by default the center of the world or the selected VM Grid object, but can be changed by selecting any object and choosing Simulation»Camera»Pivot (Ctrl P). As a quick shortcut, double-clicking an object in a simulation window will set that object as the Pivot center and fit the object in the window.
If you prefer the second form of camera rotation by default, clear the “Default to Look-Around camera” checkbox in the Simulation»Options dialog Misc tab.
You can quickly orient the camera to point at the center of the currently selected object using the Simulation»Camera»Center (Ctrl Shift Space) menu function. Select the Simulation»Camera»Fit (Ctrl Space or Ctrl Decimal) menu function to both orient the camera towards the selected object and pan in or out so that the object fits within the simulation window.
The following is a list of camera rotation functions available when in Camera mode. Note that camera rotation is not available when a VM View filter is enabled (e.g., Front, Side…).
Rotate
Mouse
Up
Left-mouse, move forward
Down
Left-mouse, move backward
Left
Left-mouse, move left
Right
Left-mouse, move right
Camera roll:
The camera is oriented so that “up” is along the positive Z direction (of the selected VM Grid object) in all views except Top and Bottom, where “up” is instead along the positive Y direction. The following keys can be used to roll (i.e., tilt) the camera clockwise or counterclockwise.
Roll
Key
90° cclw
Ctrl Left arrow
1° cclw
Ctrl Shift Left arrow
90° clw
Ctrl Right arrow
1° clw
Ctrl Shift Right arrow
Camera origin and attachment:
You can attach the camera to an object in the scene. If the object moves, so will the camera. This can be done using the right-mouse “Attach Camera” context menu selection, which will show a check mark to indicate that the camera is attached to an object. To detach the camera, right-mouse in the background and again select Attach Camera to reset the camera back to the world origin.
The Simulation»Camera»Attach menu selection can also be used to attach the camera to the last selected object, or to detach the camera if no objects are selected. Left-mouse clicking on the background will ensure that no objects are selected.
Camera viewpoint:
The creator of the machine model can (and should) define a series of predefined views (not to be confused with the standard perspective, front, rear, etc. views described earlier) to simplify viewing the model during simulation. These might show a full view of the machine, a detailed view of the table, perhaps a view from the tool’s perspective and so on. In the absence of any view information, VM will show the machine with the camera placed well back in the negative machine Y-axis direction.
To switch between predefined views, press one of the keyboard number keys 0 through 9 while holding down the Ctrl key. If the display does not change, then that view number is undefined. You can define your own viewpoints by holding down the Ctrl and Alt keys before pressing a number key. Default views are stored with the model; personal viewpoints are stored in the vsw file where they override those of the model. Predefined views can also be activated and set using the Simulation»Camera»Load and Simulation»Camera»Save menu selections. Select Simulation»Camera»Reset to reset the predefined views to those defined and saved in the model.
The transition between views can be abrupt or smooth, depending on the camera animation setting in the Simulation»Options dialog Misc tab. Smooth transitions are only possible between predefined viewpoints sharing the same base view (e.g., two perspective views or two orthogonal views, but not between a perspective and orthogonal view).
To summarize:[1]
Left-mouse controls camera rotation.
Middle-mouse and mouse wheel control panning.
Left / Right / Up / Down arrows and Page Up / Down also control panning.
Ctrl Left / Right arrows roll the camera cclw and clw.
Shift modifies all of above functions.
Left-mouse double-click does a Fit (Ctrl Space) and Pivot (Ctrl P) on the selected object.
Ctrl P sets the camera pivot origin to the selected object.
Ctrl Space (or Ctrl .) reorients and zooms the camera to “fit” the object in the window.
Ctrl Shift Space reorients the camera to point at the selected object.
Ctrl 0 through Ctrl 9 selects one of 10 prerecorded camera positions.
Ctrl Alt 0 through Ctrl Alt 9 saves prerecorded camera positions.
Simulation»Options (Ctrl Alt O) sets camera animation and look-around properties.
Simulation»Controller
Enables the display of the Virtual Machine Controller window if hidden or minimized. Hides the Controller window if already active. This window can also be toggled from the View toolbar. The Controller window has tabs arrayed along the top to support the following functions, each of which are described below:
Viewing and jogging model axes
Viewing and setting fixture compensation
Viewing and setting length and diameter compensation
Reviewing the simulation
Status of modal G and M codes
Status of modal PPFUN commands
Simulation»Controller: Axes
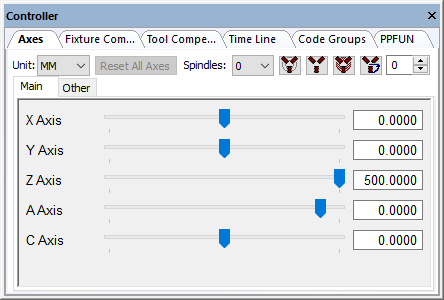
Provides interactive motion control over the axes of the model when processing is in a paused state. The sliders move each axis through its available range of travel. Linear axes positions are listed in the units selected in the Unit drop-down list. For rotary axes with unlimited travel, sliders move the axis through ±405º of travel (a full revolution plus 45º in each direction). Axes can be moved to any position (within travel or otherwise) by entering a value in the input-field next to the slider. When the Tools»Toolbar “Use tooltips on VM Controller” checkbox is selected, resting the mouse pointer over an axis name, slider bar or input-field, will pop-up a tooltip dialog showing the minimum, maximum and current axis position.
If axes names are truncated, the View»Increase X Margin (Ctrl Right) and Decrease X Margin (Ctrl Left) menu functions can be used to adjust the amount of space reserved for axes names. Some models have their axes controls grouped under multiple tabs. These can be selected using the mouse, or via the View»Previous Axes Page (Ctrl Page-Up) and Next Axes Page (Ctrl Page-Down) menu functions. Finally, the model developer may have chosen to hide some axes and/or axes groupings. These can be shown or rehidden using right-mouse “Show Hidden Tabs” and “Show Hidden Axes” context menu selections.
You can toggle the between machine linear axes and LCS (local coordinate system) linear positions using the Simulation»Show»Workpiece Coords (Ctrl W) menu function. When workpiece coordinates are enabled, the linear axes are labeled as “Xw”, “Yw” and “Zw” axes in both the Axes tab and in the HUD.

The axes can be interactively moved to a model defined reference position (e.g., tool change or home position), by first selecting the reference by name in the Ref drop-down selection field and then pressing the button to the immediate right of the reference name.
Select the Reset All Axes button to reset all axes to the last interpolated position (i.e., to the positions they were interactively changed). Axes are automatically reset whenever processing is continued. Note that it is not possible to interactively set an axis position and continue processing with the axis at that set position.
The spindle state can also be interactively controlled and tested from the Axes tab. First, select the spindle identifier in the Spindles drop-down selection field and then press one of the buttons immediately to the right as follows:

Toggles on and off the selected spindle. Any objects attached to the spindle will be swept around the spindle axis to create the volume that will then be used for collision detection and material removal. When the spindle is turning, the swept volume is displayed as a solid object. When the spindle is subsequently stopped, the swept volume continues to be shown in a transparent color (representing the fact that the position of the spindle is unknown), with the unswept object shown inside for reference purposes. Computation of swept volume from a 3D shape can be CPU intensive.

Stops and locks the selected spindle.

Places the selected spindle in neutral.

Orients the selected spindle to the angle specified in the field immediately to the right of the button. The swept profile is no longer used once a spindle is oriented, since its position is then known.
For known robot kinematics, Shoulder Right-Left, Elbow Down-Up and Wrist Front-Rear buttons retain the tool tip position and tool orientation, but change selected robot joints to test out different possible robot configurations (8 in total) for collision avoidance and reachability purposes. These controls are available for known robots only. Send ICAM’s Support department your robot model in “dmp” format to have it enabled for configuration testing.
Simulation»Controller: Fixture Compensation
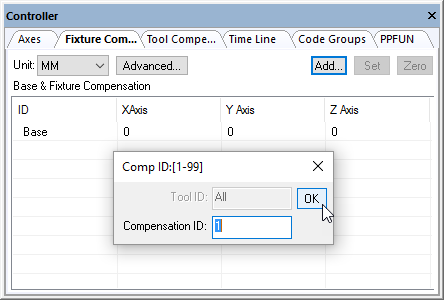
This tab provides control of fixture compensation (also known as work piece compensation). It is important to accurately set appropriate fixture compensation amounts if non-zero fixture compensation amounts will be used at the machine.
Fixture compensation offsets are identified by an integer ID number ranging from 1 up to the number of different offsets available on the CNC. For example, on a CNC with G54 through G59 codes defining fixture compensation, ID number 1 would represent G54, ID number 2 would represent G55 and so on, up to ID number 6 for G59. Select the Add button to define the compensation amounts for a particular ID. Fixture compensation is defined in the QUEST “Control Description / Tool and Fixture Compensation” questions. The Add button will not be available if fixture compensation is not defined.
The offset amounts are entered and listed in the units specified in the Unit drop-down list. Double-click on an axis entry to change its value. Use the Tab and Shift Tab keys to quickly move between entries. Press the Set button to set the offset values of the selected ID lines to the current Axes positions (as set via the Axes tab). Press the Zero button to quickly zero the offset values of the selected ID lines. You can completely remove an offset ID by selecting the entire line and pressing the Delete key.
By default, only the primary linear axes are listed. Select the Advanced button if it is necessary to choose other axes that can be offset using fixture compensation on the CNC. For example, if the CNC has the ability to offset rotary axes, you should select the Advanced button, choose the rotary axis from the list of available axes, then press the center Add button to include that rotary axis in the list of axes that can be compensated. You can later disable compensation for any axis other than a primary linear, by first selecting it in the list of axes in use and then pressing the center Remove button (the center button label dynamically changes between Add and Remove depending on the axis selected).
Base compensation is always available, whether fixture compensation is supported or not. The base compensation amounts are added to the axes position, regardless of the fixture compensation state in effect on the CNC. Base compensation should to be used to handle the case where the machine operator must manually reset the zero point of the machine to match some reference point on the fixture or part. This is common on older controls that do not have fixture compensation abilities.
The currently active fixture compensation ID can be seen in the simulation window heads-up display by activating the “Active Compensations” checkbox in the Simulation»Display dialog (Ctrl Alt D).
Fixture compensation data is automatically saved in the verification setup (.vsw) file when the program is completed. This setup file will be reused on subsequent runs to quickly reestablish the workpiece compensation settings necessary for an accurate simulation.
Simulation»Controller: Tool Compensation
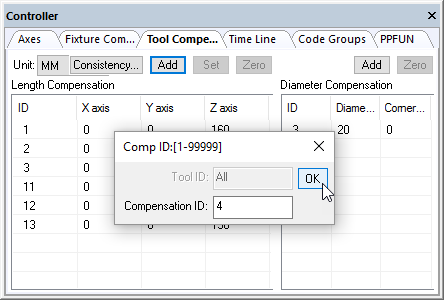
This tab provides control of tool length and tool diameter compensation. It is important to accurately set appropriate tool compensation amounts if non-zero compensation amounts will be used at the machine.
Tool length and tool diameter compensation offsets can be associated with the tool ID, or they can be defined as a simple table of offsets. When compensation is defined with respect to the tool, each offset is identified by the combination of its tool number and the offset ID for that specific tool (e.g., tool 12, offset 1). Otherwise, the compensation is defined as a simple offset ID (e.g., offset 12). Select the appropriate Add button to define the length or diameter compensation amounts for a particular offset. Tool length and diameter compensation are defined in the QUEST “Control Description / Tool and Fixture Compensation” questions. If tool length or diameter compensation is not defined then the appropriate Add button will not be available.
The offset amounts are entered and listed in the units specified in the Unit drop-down list. Double-click on an axis, diameter or corner radius entry to change its value. Use the Tab and Shift Tab keys to quickly move between entries. Press the Set button to set the offset values of the selected ID lines to the current Axes positions (as set via the Axes tab). Press the Zero button to quickly zero the offset values of the selected ID lines. You can completely remove an offset ID by selecting the entire line and pressing the Delete key.
The Consistency button checks the length compensation settings against the actual tool definitions, highlighting differences and providing the option to automatically correct the settings.
The currently active length and diameter compensation IDs can be seen in the simulation window heads-up display by activating the “Active Compensations” checkbox in the Simulation»Display dialog (Ctrl Alt D).
Tool compensation data is automatically saved in the verification setup (.vsw) file when the program is completed. This setup file will be reused on subsequent runs to quickly reestablish the tool compensation settings necessary for an accurate simulation.
Simulation»Controller: Time Line
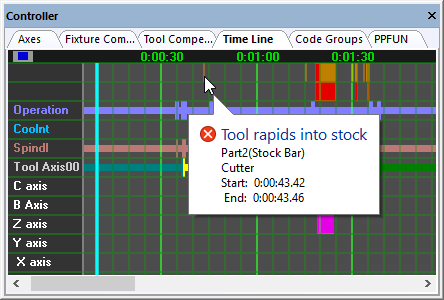
This tab provides control over the Time Line review and replay function of VM.
The time-scale listed horizontally at the top of the window represents the run time of the process. The pale blue vertical bar shows the moment in time that the simulation windows are currently showing. The light gray vertical line marks the end of the simulation. When the simulation is paused, you can use the up and down arrow keys or the mouse wheel to adjust the time scale to see more or less detail. You can also zoom in to see more detail by holding the shift key down and selecting the range of interest with the left-mouse button. The Simulation»Camera»Fit (Ctrl Space) function will fit the entire process within the Time Line window. Use the left and right arrow keys, Ctrl Home and Ctrl End keys, or the horizontal scroll bar to move the time-scale left and right. The Simulation»Camera»Center (Ctrl Shift Space) function will center the time-scale at the current selected time. Changes to the time-scale can be undone and redone using the Ctrl Z and Ctrl Y keys.
When the simulation is paused, you can click with the left-mouse button anywhere within the Time Line to see, in the simulation windows, the state of the simulation at that moment in time. Hold the left-mouse button down and drag the mouse left and right to replay the simulation forwards and backwards in time. Click with the right-mouse button anywhere within the window to see a pop-up context menu. The “Synchronize” choice will synchronize the selected moment in the Time Line display with the simulation windows as well as the source and trace windows. Double-clicking in the Time Line display synchronizes at that point. The “Play from here” choice will replay the simulation from the selected point, using the continuous animation control setting.
Tooltip information describes the collision, overtravel, tool, etcetera, event of interest under the cursor. Tooltips identify the start and ending time of the event as well as other pertinent information. For example, Spindle tooltips indicate the spindle speed and direction of rotation.
The right-mouse pop-up context menu “Show” choice can be used to select the type of information to be shown in the Time Line window, in the form of horizontal colored bars:
Channel data: provided channel creation, deletion, activation, deactivation, starvation, synchronization points, idle and wait time.
Collisions: When MRS (material removal simulation) is active, all collisions involving the in-process stock (e.g., tool rapids into stock) are identified by horizontal amber bars at the top edge of the window; the left edge of the amber bar marks the start of the motion where a collision occurs and the corresponding right edge marks the start of the next motion where the in-process stock is again collision free. Probe touch events are indicated by yellow markers. All other non in-process stock related collisions are identified by a red bar; the left edge of the red bar marks the moment in time where a collision occurs and the corresponding right edge marks the point where the simulation is again collision free.
Operation names: A solid horizontal bar indicates a named operation and vertical markers indicate operation boundaries, provided that OPNAME commands are coded.
Coolant events: A solid horizontal bar indicates when any type of coolant is active. Vertical markers indicate a change in coolant state.
Spindle events: A solid horizontal bar indicates when the spindle is rotating. Vertical markers indicate a change in spindle state.
Tool usage: A solid horizontal bar indicates when a tool is loaded. The color of the bar matches the “cut color” of the tool. Vertical markers indicate a tool change.
Head usage: A solid horizontal bar indicates when a head is loaded. Vertical markers indicate a head change.
Axes overtravel: Motion axes overtravel conditions are individually identified by horizontal light purple bars drawn level with the axis on which an overtravel occurs; the left edge of the light purple bar marks the moment in time where an overtravel occurs and the corresponding right edge marks the point where the axis is once again within travel.
Channel extra data: Provide channel data for channel that are created by the user for other purpose such as tool changer mechanism or UHF devices.
The right-mouse pop-up context menu “Next/Previous” choice can be used to search forwards and backwards in time to the next collision, probe touch, tool change, head change or overtravel event. The F3 and Shift F3 keys cause the Time Line to advance and synchronize to the next or previous event, or optionally to the end or beginning of the process if there are no other events of the type being searched.
The right-mouse pop-up context menu “Display feed optimization” choice toggles between a normal view as described above and a view showing the results of SmartFEED optimizations as calculated by the post-processor. When in the feed optimization view, the right-mouse pop-up context menu “Show” choice can be used to select the type of information to be shown in the Time Line window, in the form of graphs:
Volume: The volume of material removed.
MRR and Opt MRR: The material removal rate before and after optimization.
Feed and Opt Feed: The tool velocity before and after optimization.
The Simulation»Options dialog Time Line tab provides the following display options: the ability to animate (i.e., smooth) transitions when moving from one moment in time to another; tool path trace coloring options; F3 and Shift F3 search options; a tooltip information enable/disable option; and an optional upper limit on RAM consumed by Time Line (if memory limitations become an issue).
The Time Line window horizontal scroll bar shows a miniature of the entire process, with the portion currently visible in the Time Line view highlighted. We call this the “Time Line Miniature” or TLM for short. The TLM box can be dragged and manipulated in the same way as any horizontal scrollbar thumb control. In addition, holding the SHIFT key before left clicking and then dragging in the TLM (i.e., selecting a region in the horizontal bar) will set the main Time Line view to the selected time range.
The TLM shows key information from the main Time Line whether selected for display or not. This includes object collisions, MRS collisions, over travels and tool changes.
The TLM also features an easy access toolbar at the bottom-left, providing quick access to the following features of the Time Line:
Undo/Redo undo or reapply Time Line zoom and pan changes
Fit to zoom out the Time Line to view the entire process
Find previous/next to search for the next occurrence of the selected search target
Simulation»Controller: Code Groups
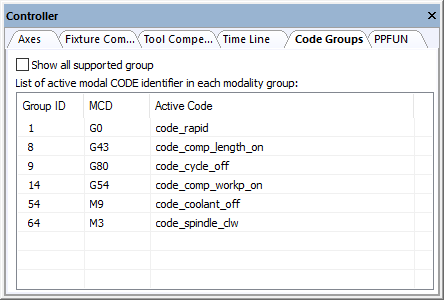
The Code Groups tab can be used to view the currently active code for the various G and M modal code groups maintained by the post-processor. Code groups are listed by their internal number (roughly based on Fanuc code groupings). The currently active code for each group is listed beside its group number if known, otherwise CODE_NONE is shown.
Codes are highlighted when changed.
The following are some of the most commonly used code groups:
- 1:
Interpolation mode
- 2:
XY, YZ, ZX plane
- 3:
Absolute vs. incremental positioning
- 5:
uPM, uPR and 1/t feed mode
- 6:
Inch vs. mm units
- 7:
Tool length compensation
- 8:
Tool diameter compensation
- 9:
Cycle
- 13:
Rpm vs. constant surface speed spindle mode
- 14:
Fixture (workpiece) compensation
- 54:
Coolant
- 64:
Spindle
Simulation»Controller: PPFUN
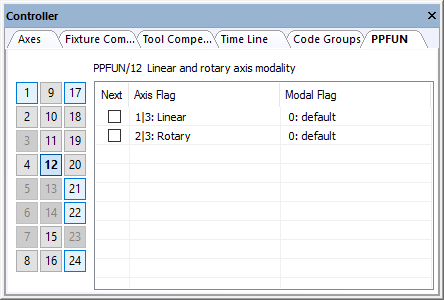
This tab lists the current state of all PPFUN commands that have a modal or one-shot effect on processing.
PPFUN command numbers are listed in a table at the left side if the window. PPFUN information is not applicable for command numbers 3, 5, 6, 13, 14 and 23. The command numbers will be highlighted if active for all other PPFUN commands.
The right side of the window shows PPFUN command information for the selected PPFUN command number. This information can be viewed but not changed.
Simulation»Manager
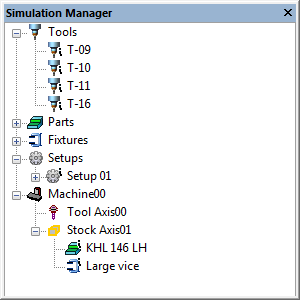
Enables the display of the Virtual Machine Simulation Manager window if hidden or minimized. Hides the Simulation Manager window if already active. This window can be toggled from the View toolbar. The Simulation Manager window lists all of the components included in the simulation (i.e., tools, parts, fixtures) and where they are attached to the model. E.g., parts and fixtures will be shown attached to stock mount points.
Double-clicking on a component or group header will activate a dialog that permits modification of the selected component. As well, pressing the right-mouse button on any component or group header will bring up a context menu listing the actions that are available with the selected entry.
Tools: Lists the tools defined in the simulation. Double-click the header to activate the Simulation»Tools/Holders/Heads dialog (see here Double-click a tool to view or modify it. Use the right-mouse context menu to change where tools are attached.
Parts and Fixtures: Lists the parts and fixtures defined in the simulation. Double-click the header to activate the Simulation»Parts/Fixtures dialog (see here). Double-click a part or fixture to view or modify it. Use the right-mouse context menu to change where parts and fixtures are attached.
Setups: Lists the setups defined in the simulation. Double-click a setup to view it. Use the right-mouse context menu to add, copy or delete setups. Within each individual setup, use the right-mouse context menu to add or remove components from that setup as well as to modify the properties (e.g., position and orientation) of those components. Setups are activated in the post-processor by a LOAD/SETUP command or by calling the $FMSSETUP() macro function.
Model name: Lists the components currently attached to the model tool and stock axes. Double-click a component to view or modify it. Use the right-mouse context menu to unload a component.
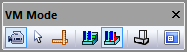
Simulation»Mode»Camera
When the Camera mode menu bar selection is active, holding the left-mouse button down while moving the mouse changes the orientation of the camera. The cursor appears as a four-way arrow when in Camera mode. This mode can also be activated by selecting the leftmost button in the VM Mode toolbar above. While in Camera mode, you can press and hold the Ctrl key to temporarily switch to Selection mode. This can be used to quickly select objects to rotate about or to attach the camera to.
There are two types of camera rotation.
The default rotation is to keep the camera position fixed but to change where the camera is aimed. This is similar to how we rotate our head to look around a scene.
You can hold the Shift key to change how the camera rotates. When Shift is pressed, the camera rotates around a point in space. This rotation point is by default the center of the world or the selected VM Grid object, but can be changed by selecting any object and choosing Simulation»Camera»Pivot (Ctrl P). As a quick shortcut, double-clicking an object in a simulation window will set that object as the Pivot center and fit the object in the window.
If you prefer the second form of camera rotation by default, clear the “Default to Look-Around camera” checkbox in the Simulation»Options dialog Misc tab.
Simulation»Mode»Selection
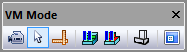
When the Selection mode menu bar selection is active, pressing the left-mouse button selects the object under the mouse pointer. The cursor appears as a simple arrow when in Selection mode. This mode can also be activated by selecting the second button on the left in the VM Mode toolbar above. While in Selection mode, you can press and hold the Ctrl key to temporarily switch to Camera mode. This can be used to get a better view of the object you are trying to select.
Selection mode is useful when developing models with QUEST, or to select objects to make them transparent, or to hide selected objects using the Simulation»Hide Selection (Ctrl B) menu bar selection.
Simulation»Mode»Measurement
When the Measurement mode menu bar selection is active, pressing the left-mouse button selects the object under the mouse pointer for measurement purposes. Measurements can be taken between any objects, including in-process stock. The cursor appears as an arrow with calipers when in Measurement mode and measurement results are shown in the simulation window in the form of a small HUD (heads-up display). Measurement mode can also be activated by selecting the third button to the left in the VM Mode toolbar above. While in Measurement mode, you can press and hold the Ctrl key to temporarily switch to Camera mode. The ESC key repeatedly undoes selections.
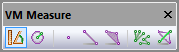
The VM Measure toolbar (available when in measurement mode) provides various buttons to define the type of measurement, the types of objects being measured, and chained vs. fanned measuring options. See “Simulation»Measure” for more information.
The VM Cross Section toolbar can be used to obtain a cross section view of the in-process stock, which can facilitate measurement of normally hidden features or measurements taken in the section plane. See “Simulation»Show»Cross Section…” for more information.
Simulation»Mode»Pause Material Removal
When the “Pause Material Removal” menu bar selection is active, the in-process stock and machinable fixtures will not be affected by the cutting action of the tool. This function temporarily disables material removal simulation (MRS). This MRS setting can also be toggled by selecting the leftmost of the two “pause” buttons in the VM Mode toolbar above.
Temporarily inhibiting MRS can be useful to ignore further invalid cutting actions of a tool, during the early simulation phase of a manufacturing program. Also, when used with Run»Restart (Shift F5) a program can be quickly run once without MRS, and if necessary a second time with MRS following the restart, without having to change the “Enable Material Removal Simulation” setting in the launch panel VM tab.
Simulation»Mode»Pause Gouge Detection
When the “Pause Gouge Detection” menu bar selection is active, interference (i.e., collisions) will no longer be diagnosed between the cutting tool and the design part. This mode can also be toggled by selecting the rightmost of the two “pause” buttons in the VM Mode toolbar above.
Temporarily inhibiting tool/part collisions can be useful to speed up scribing or engraving operations, if part design does not include the image being scribed or engraved.
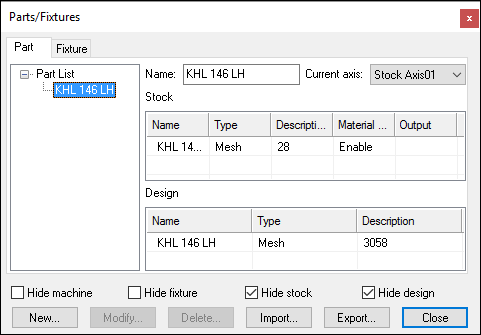
Simulation»Parts/Fixtures (Ctrl Alt P)
This menu bar selection provides the ability to add parts and fixtures to the simulation. This information is stored in a 3D model (.m3d) file, in the same directory and with the same name as the verification setup (.vsw) file. These two files are automatically saved when the program is completed. They will be reused on subsequent runs to quickly reestablish the material conditions necessary for an accurate simulation.
Parts can be composed of both a rough stock, used for material removal simulation, and the design part, to which it can be compared using the Simulation»Compare (Ctrl Alt Q) function (see here). Fixtures can be composed of both machinable and non-machinable components. These are all treated differently in VM during collision testing. The differences are as follows:
Part»Design: The cutting portion of the tool can interfere (without diagnostics) with the design part, to the extent of the gouge tolerance. The gouge tolerance amount is defined in the Simulation»Options dialog Tolerances tab. Some gouging is to be expected, due to the effects of the manufacturing tolerance used by the CAM system when creating the tool path and the tolerance used in the creation of the STL part model. If CAM manufacturing and STL tolerances are not adjusted, the gouge tolerance should not have to be changed from one part to the next.
The non-cutting portion of the tool, the tool holder and all other collision-enabled components of the machine are also tested for collision with the design part. The gouge tolerance is not applied when testing for part collision with these components.
Part»Stock: With the Material Removal Simulation (MRS) license option enabled, VM can compute the in-process state of the raw stock. The path of the cutting portion of the tool will be “subtracted” from the stock during the manufacturing process in the same way that material is removed during real machining. Motions that cut the stock at rapid or while the spindle is stopped, will be diagnosed with an error. These cuts will also appear highlighted on the in-process stock object and identified as a collision in the Time Line display. Individual components of the stock can be enabled or disabled for MRS simulation using the component’s Material Removal column setting.
If an MRS license is not available or not enabled, any object defined as stock is shown in the simulation windows but is ignored for collision testing purposes. To enable collision testing on a near-net stock shape, define it instead as machinable fixture. This will allow only the cutting portion of the tool to interfere with the stock provided that the motion is at feed and the spindle is turning.
Fixture: Individual components of a fixture can be identified as machinable or not, which affects how they are tested for collisions.
A machinable component might be a “soft” clamp or plate that will be cut by the tool during the manufacturing process. With the Material Removal Simulation (MRS) license option enabled, VM can optionally compute the in-process state of machinable fixture components, treating them as though they were defined as stock objects (see stock definition above).
If an MRS license is not available, or is not enabled for a machinable fixture component, then the cutting portion of the tool is not tested for collision with the fixture component if the tool is spinning and the cutting motion is at feed. The non-cutting portion of the tool, the tool holder and all other collision-enabled components of the machine are always tested for collision with machinable fixture components.
Non-machinable fixture components are always tested for collision against the entire tool, the tool holder and all other collision-enabled components of the machine.
VM does not check for interference between part and fixture, so they can partially or completely overlap each other without problems.
Collision testing is performed by sampling the motions of the machine along the tool path. The rate of sampling, called the collision tolerance, is defined in the Simulation»Options dialog Tolerances tab. This collision tolerance value should match the finest CAM manufacturing tolerance used in the part program. The collision tolerance is a modal value stored in the Windows Registry; it is not stored on a program-by-program basis in the verification setup (.vsw) file.
Objects are maintained in two lists, accessible by selecting one of the Part or Fixture tabs at the upper left corner of the dialog. For each type, a navigator along the left hand side of the dialog lists all of the objects defined for that specific type. For example, a fixture might consist of many parts, such as a base plate, clamps, spacers and so on. Select Import to bring in the part and fixture definitions from a different part program. Select Export to save the current part and fixture definitions to a named file for use in a different part program.
Select the top entry in the navigator to see list of objects for the selected type. Select New followed by New Part or New Fixture to create a new object. The object’s name is used by VM when reporting collision diagnostics. The object’s current axis defines the stock axis (or mounting point) where the object will be attached to the machine model at the start of the program. Machine models with multiple tables or pallets may define multiple stock axes. Click on an entry in the table to change the object’s name, its default axis (used when the program starts) or the current axis (the association in force at this point in the program). Setting the current axis value to “None” removes the part or fixture from the simulation, but not from the list of objects. You can select one or more objects in the right hand list and press the Delete button to completely remove them.
Each object can consist of one or more physical components, which are listed when you select an object name in the left hand list box, or when you select an object in the right hand object list and press the Modify button. Each component of an object can be given a name, which will be reported during collision diagnostics (e.g., “KHL 146 LH”). Fixture components can be tagged as machinable or not. Part components are never machinable; stock components are ignored for collision testing purposes.
Select the New button to add a new component. The following component types can be added:
Cube: Defines a cubic (i.e., box) entity given the XYX coordinates of one corner and the width, length and height (∆XYZ).
Cylinder: Defines a cylindrical or conical entity given an XYZ coordinate of the center, an initial radius, a final radius and the overall height. The surface of the cylinder is approximated by a number of faces, which can be specified. The light rendering at the edges between faces can be set smooth or sharp, allowing a hexagon shape to be defined.
Cone: Defines a conical entity given an XYZ coordinate of the center, an initial radius, a final radius and the overall height. The Cone and Cylinder definitions are identical; they differ during construction only.
Sphere: Defines a spherical entity given an XYZ coordinate of the center and a radius. The surface of the sphere is approximated by a number of faces, which can be controlled by the subdivision size (0 produces a 20 face icosahedron and each increase in subdivision value increases the faces by a factor of 3). The light rendering at the edges between faces can be set smooth or sharp.
Import STL: Imports an STL file relative to a specified XYZ location in the model. A “Smoothing” function can improve the appearance of faceted surfaces by using smooth light rendering at edges that have a change of angle within a specified amount.
Components are created interactively in the simulation window. The various Hide… checkboxes can be selected to reduce the visual clutter in the simulation window during component creation. When a component is being created, its type and required parameters are listed at the bottom of the simulation window. You can enter the parameters using the keyboard, or you can move the mouse to an appropriate position and click the left-mouse button. Each click of the mouse can supply values for one or two parameters. You can change the camera position, standard view or user-defined viewpoint at any time. Use the Tab and Shift Tab keys to move forwards and back through the required parameters to make changes. When creating new objects with the mouse, the pointer might be locked to a fixed grid size. You can temporarily toggle the grid setting by pressing the Shift key. Select Simulation»Grid (Ctrl Alt G) to make changes to the default grid.
Existing objects can be selected from the component list and modified by pressing the Modify button, or removed from the object by pressing the Delete button.
When the Material Removal Simulation (MRS) license option is enabled, stock and machinable fixture components can be enabled or disabled for MRS simulation using the object’s Material Removal column setting. The MRS in-process stock result can be compared to the design part using the Simulation»Compare (Ctrl Alt Q) and Simulation»Show»Filters»Boolean… functions. The in-process stock result can also be automatically saved at the end of processing (provided the process is not ended early) by specifying an Output file for each stock component.
When running VM with a Manufacturing Extractor, the association between stock and design part will automatically be set, and stock will be enabled for MRS and output at completion.
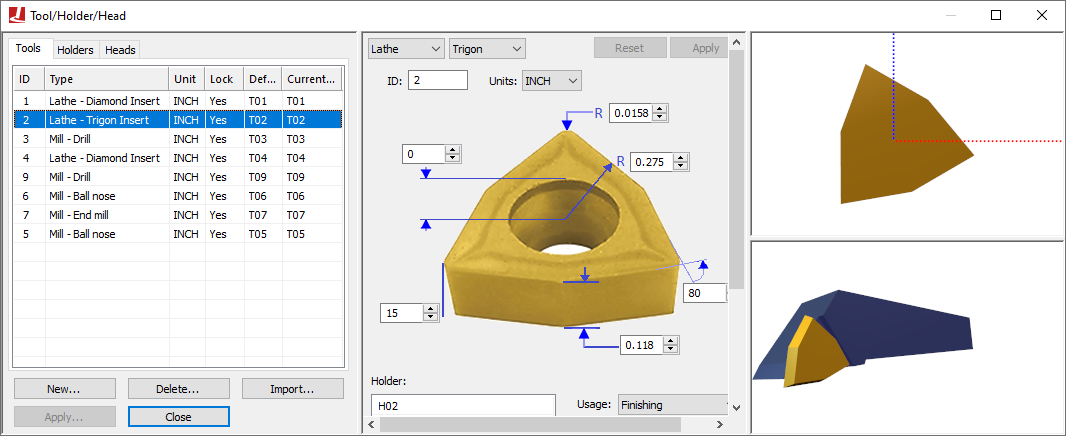
Simulation»Tools/Holders/Heads (Ctrl Alt T)
This menu bar selection provides the ability to add tool and associated holder definitions to the simulation, as well as to select the active head on a machine that supports multiple head attachments.
Tool and holder definitions are automatically saved in the verification setup (.vsw) file when the program is completed. This setup file will be reused on subsequent runs to quickly reestablish the tooling necessary for an accurate simulation. Tool and holder definitions from another part program can be imported into the current session by pressing the Import button and then selecting the verification setup (.vsw) file of the other part program.
Tooling definitions, like fixture and part definitions, are not a required element for simulation, but if used they add to simulation accuracy and realism. VM attaches solid model representations of holders and tools to the spindle control point (SCP). Once attached, they become a part of the collision detection process. Details about tool and holder definitions can be found in the “Virtual Machine V26 Users Guide”.
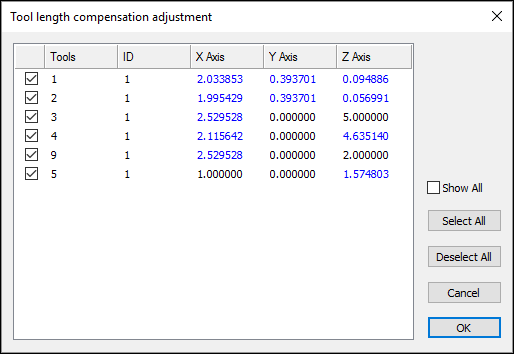
When exiting the Tools/ Holders/Heads dialog, VM will validate the tool and holder dimensions against the Controller window tool and diameter compensation amounts. If they do not agree with the tool definitions, a dialog will appear (as shown at right) listing suggested tool compensation changes highlighted in blue. Selecting OK will automatically adjust the tool compensation for the selected tools.
Tools:
Select the Tools tab to add, modify or delete tool definitions. Select the New button to define a new tool. Select an existing tool definition to modify that tool. Select one or more tools and press the Delete button to remove the selected tools. The tool table lists the following information for each tool:
ID: Identifies the tool using the native form of tool numbering on the controller.
Type: Lists the tool type as defined when the tool was created or last modified.
Unit: Shows the units of measure used for non-angular tool dimensions.
Lock: GENER will automatically define a default milling or drilling tool if a tool definition does not exist for the one being loaded. GENER uses the APT CUTTER command to define the shape of the tool. Tools defined in this way have a cutting length equal to the total tool length, and do not have a shank or associated holder. Automatically created tools are by default “unlocked” (i.e., the Lock state is “No”); meaning that their definition will change each time a CUTTER command is encountered. Any tool that is created manually or that is subsequently modified is set locked (i.e., the Lock state is “Yes”) so that these modifications will not be overridden. Double-click on this field to change the locked state of a tool.
Default pocket: Used when simulating models that define tool pocket locations. Double click on this field to choose the pocket where the tool will reside.
Current pocket: The current location of the tool. This field is updated dynamically by VM as tools are loaded. You can manually insert a tool into the spindle by double clicking on this field and selecting the primary tool axis.
Holders:
Select the Holders tab to add, modify or delete holder definitions. Select the New button to define a new holder. Select an existing holder definition to modify that holder. Select one or more holders and press the Delete button to remove the selected holders. Holders are associated with tools using the Tools dialog. The holder table lists the following information for each holder:
ID: A textual identification of the holder.
Type: Identifies the sub-type of the holder as being Revolved (a holder defined by a 2D profile revolved about the spindle axis) or Generic (a holder defined by one or more STL meshes).
Unit: Defines the units of measure for non-angular holder dimensions.
Heads:
A head is a removable device that attaches to the machine and which provides some form of extended machining capability. Common examples of such devices are 90 degree angled heads that mount the tool at an angle, long reach heads that extend the Z axis travel of the tool and heads with one or more controllable rotary axes that provide 4 or 5-axis control of the tool. Head devices (there can be multiple heads) are predefined in the model.
The head table lists the following information for each head defined in the model:
ID: Identifies the head using the native form of head numbering on the controller.
Name: Identifies the head using the name assigned by the creator of the VM model.
Current station: The current location of the head. This field is updated dynamically by VM as heads are loaded. You can manually load or park a head by double clicking on this field and selecting a head attachment point from the drop-down list.
Head attachment points are defined in the model with QUEST using the Simulation»Construct Axis»Head axis menu selection. Only one head at a time can reside at any single head attachment point.
Simulation»Camera
Controls various aspects of the positioning of the camera.
Simulation»Camera»Fit (Ctrl Space[2])
The Camera Fit function first points the camera towards the center of the currently selected object and then pans in or out so that the selected object is fully visible within the active simulation window. If no object is selected, then the camera will be adjusted to view the entire model. You can use this function to quickly reorient the camera when you are unsure of where you are pointing or if you cannot see the model. The Fit function is also available from the VM View toolbar.
When the current focus is on the Controller Time Line window, the Fit function will adjust the scale of the Time Line window so that the entire process is visible.
Simulation»Camera»Center (Ctrl Shift Space)
The Camera Center function points the camera towards the center of the currently selected object, or if no object is selected, then towards the origin of the Grid reference (i.e., the center of the three grids).
When the current focus is on the Controller Time Line window, the Center function will adjust the position of the Time Line scale so that the blue vertical line (marking the current time position) is visible and centered in the Time Line window.
Simulation»Camera»Pivot (Ctrl P)
The Camera Pivot function sets the center of rotation for the camera to the center of the currently selected object. The pivot center is the point in space at which the camera will aim as it is rotated. If no object is selected, then the camera will rotate about the origin of the Grid reference (i.e., the center of the three grids).
Simulation»Camera»Attach
Attaches the camera to the currently selected object. If no object is selected, the camera is attached to the world coordinate system (this is the default). When the camera is attached to an object, the camera moves with the object. Standard viewpoints are always in relation to the attached object. The camera can also be attached to an object using the right-mouse “Attach Camera” context menu on that object. The camera can be detached by doing the same in the background. A check mark in the menu indicates that the camera is attached to an object.
Simulation»Camera»Perspective
Switches between Perspective and Orthogonal projection in the simulation window. The Perspective projection provides a more realistic viewing of the simulation, equivalent to what you would see in the natural world. With Orthogonal projection, distance has no effect on the size of an object. Orthogonal views typically provide better control when defining part, stock and fixture objects.
Switches the camera to one of six standard viewpoints (the VM View toolbar shown at left provides buttons for each standard viewpoint). Viewpoints are relative to the frame defined in the VM Grid toolbar (the stock axis by default).
The camera can only be panned (i.e., not rotated) when a standard viewpoint is selected. You can select and then immediately deselect a view button, to first snap to a standard view and then allow camera rotation.
Simulation»Camera»Speed (Ctrl +, Ctrl –)
The Speed»Increase and Speed»Decrease menu selections (Ctrl + and Ctrl –) adjust the default step size used when panning the camera. Each activation of the menu will only adjust the speed setting by one notch, so it is far more convenient to use the shortcut keys. When adjusting the camera speed, a “volume control” type bar will appear briefly in the simulation windows to show a relative measure of the current step size.
The step size can be temporarily reduced, while panning, to 1/10th the normal amount by holding the Shift key.
Simulation»Camera»View Angle (Shift +, Shift –)
The View Angle»Increase and View Angle»Decrease menu selections (Shift + and Shift –) adjust the viewing angle of the camera lens. Each activation of the menu will only adjust the viewing angle by one notch, so it is far more convenient to use the shortcut keys. When adjusting the angle, a viewing angle size indicator will appear briefly in the simulation windows.
The default viewing angle is 45 degrees. Increasing the viewing angle makes it possible to see more of the scene, at the expense of some distortion. Decreasing the viewing angle makes it possible to look at the scene in fine detail, but also makes it a little harder to navigate.
The viewing angle is used in Perspective mode only.
The Camera Save menu selection (Ctrl Alt 0 through Ctrl Alt 9) records the current camera viewpoint, position and orientation in one of 10 standard user-defined viewpoints. The Camera Load menu selection (Ctrl 0 through Ctrl 9) resets the camera to a previously saved position. The camera can directly switch to the new position, or it can smoothly interpolate to the new position, if both the old and new positions share the same underlying viewpoint (e.g., both are perspective views, or both are front views). The Camera animation mode can be set in the Simulation»Options dialog Misc tab “use camera animation” checkbox.
Simulation»Camera»Reset
The Camera Reset menu entry resets all camera settings and moves the camera to an application default viewpoint. The reset operation also removes all saved camera viewpoints and resets the camera speed and viewing angle to the application defaults.
Simulation»Show
Toggles the display of various visual aids, including: wireframe vs. solid rendering, tool path tracing, visibility of various component categories (i.e., filters), datum reference grids, coordinate system markers, kinematics component markers, reference point markers, safety zone visibility, workpiece vs. model coordinates, and the heads-up display.
Simulation»Show»Wireframe
The Show Wireframe function switches between solid and wireframe rendering of the simulation window.
Wireframe mode enables objects that are behind others to be seen. However, an object that is obscured by another still cannot be selected with the mouse pointer, even when in wireframe mode, because the selection is done on the faces of surfaces, not on their vertices.
When looking at the backside of a surface in “solid” mode, the surface may appear as solid, or as wireframe, or invisible. This setting is controlled by the “Backface” options in the Simulation»Options dialog Misc tab.
Simulation»Show»Tool Path (Ctrl T)
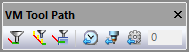
The Show Tool Path function shows or hides tool path tracing in the simulation window. Tracing can also be toggled from the VM Tool Path toolbar. Tracing shows the path of the tool with respect to the part. Rotary motions may cause linear tool paths to appear as curves; this is natural and reflects the actual path of the tool with respect to the part. The toolbar can be used to limit the trace to a specified elapsed time, or for a specified number of tools or operations.
The tool path trace shows different colors for rapid and feed motions. The default is red for rapid positioning motions and green for all feed interpolated motions. Tool paths modified in some form by SmartPATH, SmartCUT and SmartFEED, can show different colors and dash styles to indicate the type of modification. When using the “Synchronize” feature from a Trace window, the Source window, the Time Line, or from an in-process stock cut in the simulation window, then the corresponding motion is instead traced in blue. The trace can appear at the tool-tip or the spindle control point.
The trace can be limited to a specified elapsed time, or it can show the tool path for a specified number of tools or operations, or for the entire program. Trace options can be set in the VM Tool Path toolbar as well as in the Simulation»Options dialog Tool path tab.
Simulation»Show»Tool Vector
The Show Tool Vector function shows or hides the tool axis vector when tool path tracing is enabled in the simulation window. Tool axis vector tracing can also be toggled from the VM Tool Path toolbar. The length, color and line style of the tool axis vector can be set in the Simulation»Options dialog Tool path tab.
Simulation»Show»Tool Path as Overlay (Ctrl Shift T)
Selecting the Show Tool Path as Overlay function will ensure that the tool path always remains visible, even when it would normally be hidden behind other objects in the scene. The overlay setting can also be toggled from the VM Tool Path toolbar.
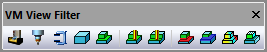
The Show Filter functions are toggles that activate or deactivate the display of various components in the scene. Filters can also be toggled from the VM View Filters toolbar.
The Machine filter toggles the display of all components defined within the model. This includes the machine, heads and any other model objects as defined and saved in the model with QUEST.
The Tools filter toggles the display of all tooling components defined at run-time via the Simulation»Tools (Ctrl Alt T) dialog. This includes tools and their holders, both active and inactive.
The Fixtures filter toggles the display of the holding devices as defined at run-time via the Simulation»Parts/Fixtures (Ctrl Alt P) dialog Fixtures tab.
The Stock and Parts filters toggle the display of the workpiece as defined at run-time via the Simulation»Parts/Fixtures dialog Part tab. The stock is the original uncut raw stock at the start of processing; the part is the design part.
The remaining filters are only available when the Material Removal Simulation (MRS) license option is enabled.
The In-process Stock filter toggles the display of the stock as modified by the cutting action of the tools. At the start of processing, the Stock and In-process Stock are identical, but they should be quite different by the end of processing.
The Stock Checkpoints filter toggles the display of the in-process stock as it appeared at earlier moments in time when moving the Time Line backwards and forwards. These earlier checkpoints can be taken at each tool change, at each operation and/or periodically during long cutting sequences as controlled from the Simulation»Options menu MRS tab “In-process stock checkpoints” settings.
The Boolean Overcut filter toggles the display of any gouges in the in-process stock as compared to the original part. Gouges are shown in red. VM only compares those in-process stock and part components that are associated to each other. Part/stock association is done from the Simulation»Parts/Fixtures menu.
The Boolean Undercut filter similarly toggles the display of excess in-process stock when compared to the original part. Excess material is shown in blue.
The Colorized Boolean filter modifies the color of the Boolean overcut and undercut regions, based on the thickness of the gouge or excess material. Colorized Boolean settings are controlled from the Simulation»Compare (Ctrl Alt Q) dialog.
The Transparent Zero filter modifies the display of the colorized Boolean comparison, to show in a transparent color all faces of the object that are in the tolerance zone between gouge and excess material. This setting can be used to see a gouge or excess in the context of the entire part.
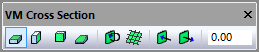
The Show Cross Section functions can be used to obtain a cross section view of the in-process stock, which is only available when the Material Removal Simulation (MRS) license option is enabled. These functions can also be accessed from the VM Cross Section toolbar.
The XY, YZ and ZX Plane selections cause the stock to be sectioned along the specified stock mount point plane.
The Custom Plane selection can be used to define a cross section plane using the Simulation»Measure picking functions described here. For example, a cross section plane can be defined by picking a face, or by picking 3 points that lie on the plane, etc.
The Invert Plane button toggles between showing the in-process stock on one side of the cross section plane or the other.
The Show Grid button enables or disables the display of a grid on the cross section plane. Grid settings are the same as for the Simulation»Grid feature.
The Push and Pull Plane buttons offset the cross section plane by a fixed amount as defined in the Simulation»Options dialog Misc tab.
The Plane Offset input field in the toolbar shows the current cross section plane offset resulting from the Push or Pull Plane functions. A value can also be entered into this field to define the required offset.
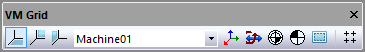
The Show XYZ Plane Grid functions activate or deactivate wireframe grids showing the XY, YZ and ZX datum planes of the model. Grid visibility can also be toggled from the VM Grid toolbar. Grids are normally displayed with respect to the base frame of the model, but this can be changed by selecting a different frame of interest from the drop-down list on the VM Grid toolbar.
Grid spacing, colors, units and other settings are all controlled by selecting Simulation»Grid (Ctrl Alt G).
Simulation»Show»Axes Marker
The Show Axes Marker function shows or hides the axes arrows that show the origin (i.e., 0,0,0 point) of the currently selected object. These markers can also be toggled from the VM Grid toolbar.
By default, each axis appears in a different color; red for X, green for Y and blue for Z. The axes marker color settings as well as the arrow appearance and size can all be changed by selecting Simulation»Grid (Ctrl Alt G).
Simulation»Show»Kinematics
The Show Kinematics function shows or hides the markers that identify all axes types except for Reference Axes. The visible marker types are as follows:
A linear axis appears as a pale blue ribbon line with arrows at each end. The current axis position is indicated by a darker colored band.
A rotary axis appears as a light mauve ribbon arc, with a single arrow serving the dual purpose of pointing in the positive rotation direction and indicating the current position.
A curve axis appears as a dark mauve ribbon connecting each of the points in the curve axis profile. The current axis position is indicated by a lighter colored band.
A tool axis appears as two 2D profiles of a holder and tool; one aligned with the X axis and the other with the Y axis.
A stock axis appears as a gold colored rectangle, with an internal red-green-blue coordinate frame marker.
A head axis appears as a gold colored 2D profile of a 90º head.
A reference axis appears as a red-green-blue coordinate frame marker. The kinematics markers can also be toggled from the VM Grid toolbar.
These functions show or hide markers that identify reference positions calculated by the virtual controller. The reference marker types are as follows:
The Workpiece Reference toggles the display of a marker in the simulation window showing the origin and orientation of the workpiece coordinate frame. This frame includes the effects of fixture compensation, RTCP and any local coordinate system.
The Tool Reference toggles the display of a marker in the simulation window showing the offset at the spindle control point (SCP) due to the effects of tool length or tool offset compensation.
The reference markers can also be toggled from the VM Grid toolbar.
Simulation»Show»Safety Zones
The Show Safety Zones function enables or disables the display of the safety zone that surrounds any collision enabled object that also has a safety clearance distance defined. The safety zone appears as a transparent light blue surface, offset from the original surface by the safety distance.
An object’s safety zone is always shown in transparent orange when another collision-enabled object touches it, regardless of the Show Safety Zones setting. Colliding objects are always shown in transparent red. The intersection between colliding objects is shown as a bright yellow line, unless “Show collision interference” is disabled in the Simulation»Options dialog Misc tab.
Safety zone visibility can also be toggled from the VM Grid toolbar.
Simulation»Show»Workpiece Coords (Ctrl W)
The Show Workpiece Coords function toggles between the display of linear axes values and workpiece linear coordinates in both the Controller Axes tab and the simulation window HUD. When workpiece coordinates are enabled, the linear axes are labeled Xw, Yw and Zw. The value shown is the distance from the local coordinate system (LCS) origin.
The Display menu selection shows or hides the “heads-up” status display that floats in front of the simulation window. The HUD lists the status of various components of the machine (e.g., current tool, axes positions, feed rate). The content of the heads-up displays (there can be many) are defined by selecting Simulation»Display (Ctrl Alt D) described here.
Display menu choices are stored in the Windows Registry; not with the model or the “.vsw” setup file.
During GENER processing, you can cycle between the various display content types using the Next Display and Previous Display menu selections (Ctrl D and Ctrl Shift D). The heads-up display can also be cycled from the VM Mode toolbar.
Simulation»Measure
The Simulation»Measure settings only take effect while in measurement mode, as set using the measurement mode button on the VM Mode toolbar or Simulation»Mode»Measurement menu bar. Once in measurement mode, clicking with the left-mouse button causes measurements to be taken between the selected objects. Press the ESC key to undo selections. Press and hold the Ctrl key to manipulate the camera with the mouse while taking measurements.
Within VM, objects are constructed of triangles. The Simulation»Measure menu-bar functions and matching VM Measure toolbar provide the following measurement options.
The Distances and angles selection measures the distance and angle between subsequently selected entities, as well as the xyz offset between entities.
The Radius and center selection measures the radius and xyz center of a circle constructed through 3 subsequently selected points and/or edge midpoints.
The Vertex selection enables or disables the picking of points on the boundary of the triangles that make up the object.
The Edge selection enables or disables the picking of edges of the triangles.
The Face selection enables or disables the picking of faces of the triangles.
The Fan selection switches between chained (one to the next) and fanned (one to many) measurements. In fanned mode, the first selection is the primary object, which is then measured against each subsequent selection.
The Overlay selection, when enabled, ensures that the objects selected for measurement will always be visible, no matter how the camera is oriented.
If none of the Vertex, Edge or Face selections is active, then all objects can be selected.
The xyz information in the above measurements is with respect to the frame selected in the VM Grid toolbar. Measurement information appears in the form of a small HUD (heads-up display) in the simulation window.
When measuring in-process stock, the Simulation»Cross Section function can be used to section the stock for better visibility or to obtain measurements in the cross section plane.
Simulation»Annotation
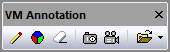
The Simulation»Annotation menu selections and corresponding VM Annotation toolbar buttons provide the capability to first (optionally) mark-up the simulation window and then take snapshots and/or videos of the simulation. The following functions are available:
The Annotate, Color and Clear selections provide a rudimentary method of superimposing freehand drawings over the simulation window. When in annotation mode, the cursor will appear as a small pencil that will draw in the simulation window when the left-mouse button is held down. Drawing is equivalent to marking a glass pane that appears on top of the simulation window.
The Snapshot selection takes a PNG image of the simulation window, including annotation data if present. Picture files are stored in the folder identified by the vm_picture_dir configuration (i.e., DEF file) variable. If this variable is not defined or is blank, then pictures are stored in the user’s “Pictures\ICAM\260” folder. Picture files are named “picnnn.png”, where nnn is a number automatically chosen to avoid overwriting an existing picture.
The Record selection enables or disables the recording of the contents of the simulation window, including annotation data if present. Video files are stored in the folder identified by the vm_video_dir configuration (i.e., DEF file) variable. If this variable is not defined or is blank, then videos are stored in the user’s “Videos\ICAM\260” folder. Videos are named “videonnn.avi” where nnn is a number automatically chosen to avoid overwriting an existing video. Recording options can be set by selecting the Video button in the Simulation»Options dialog Misc tab.
The Open selection provides quick and easy access to the user’s pictures and videos folders.
Simulation»Selection»Hide in View (Ctrl B)
The Hide in View function makes the currently selected object or objects invisible in the currently active simulation window. Compare this to the Hide in All Views function below. Once an object is hidden, it is no longer shown in the simulation window. Hidden objects continue to be tested for collisions.
To select an object, press and hold the Ctrl key (if you are in Camera mode), move the mouse pointer to the object to be selected, then press the left-mouse button. The selected object will become transparent. You can deselect an already selected object, or add more objects to the list of selected ones, by holding the Shift key down when making a selection. Press Ctrl B to make the selected objects invisible.
Hiding and selecting are two methods you can use to get an unobstructed view of the manufacturing process.
Simulation»Selection»Hide in All Views
The Hide in All Views function makes the currently selected object or objects invisible in all of the simulation windows. Compare this to the Hide in View function above.
Simulation»Selection»Show All/Rehide (Ctrl Alt B)
The Show All/Rehide function makes visible all hidden objects in the currently active simulation window. Compare this to the Show All/Rehide in All Views function below. Select this function a second time to again hide the objects that were just made visible.
Simulation»Selection»Show All/Rehide in All Views
The Show All/Rehide in All Views function makes visible all hidden objects in all of the simulation windows. Compare this to the Show All/Rehide function above. Select this function a second time to again hide the objects that were just made visible.
Simulation»Selection»Invert Hide State (Ctrl Shift B)
The Invert Hide State function reverses the “hidden” state setting for all objects in the currently active simulation window. Objects that are hidden will now be shown; those are shown will now be hidden. You can use this feature to unhide one or more selected objects, as follows:
Type Ctrl Shift B to show just the hidden (and any selected) objects
Select the objects you no longer want hidden
Type Ctrl B to remove them from view
Type Ctrl Shift B to return back to the original display
Simulation»Grid (Ctrl Alt G)
Activates the Grid dialog, which defines the boundaries and appearance of the world. The Reset button resets the grid appearance and size to reasonable values.
Grid Units can be set to any convenient value and need not match the units used when the model was created. For optimal display and control, the grid dimensions (Min/Max grid value) should exceed the dimensions of the model itself. The Grid subdivision size defines the spacing of the grid for visual clarity only (excessively small spacing can greatly increase the CPU requirements during scene rendering). The Snap to grid checkbox and associated input field define a rounding factor that can optionally be used when interactively constructing objects using the mouse pointer.
Select Grid color to set the color of the grid lines (the background color is set in the Simulation»Options dialog Misc tab).
The main axis (model origin), grid contour boundary and grid subdivision lines can all be toggled visible or invisible using the Display Show checkboxes.
The coordinate frame marker size, color and style can also be controlled from the Grid dialog. Three horizontal sliders control the size of the arrow. Colors for each axis of the marker can be set in the Colors area. The arrow style can be set using the Arrow type selection.
Simulation»Lights (Ctrl Alt L)
Activates the Light dialog, which is used to control one headlight and up to 6 separately movable light sources. VM lights are not affected by solid objects. Lights shine through objects, do not cast shadows and the lights themselves are not visible in the simulation window (but they are visible in the Light dialog to simplify placement). The Reset button sets all lights to default positions around the extremity of the grid. Lights should be reset whenever the underlying grid is reset (see Simulation»Grid). The horizontal slider rotates your viewpoint around the machine. The vertical slider changes the viewing distance.
VM provides a headlight that is located behind the camera and is directed into the scene. This optional light source makes it easier to view the workpiece or machine from the rear of the model; areas of the simulation environment where typical light placement does not reach. Because this light is mounted behind the camera, you cannot use it to differentiate the edges of identically colored and aligned faces. Two or more movable light sources must be placed around the model to be able to differentiate object edges.
Movable lights appear as small spheres, but you may have to hide the machine (clear the Objects checkbox) to see them. Lights are positioned on a hemisphere using the left and right-mouse buttons. The left-mouse button controls the position on the hemisphere. The right-mouse button controls the size of the hemisphere. To adjust the light, place the mouse pointer over the light and then press and hold either the left or the right-mouse button. Move the mouse to change the lighting position or distance. Light intensity is controlled by the individual sliders associated with each light. The color of each light can be adjusted by first selecting the box to the right of the intensity slider and then choosing a color from the color chart. Using different colors for your light sources will improve depth perception.
If a light appears immovable, the distance may have been set to a very small value. In this case, use the right-mouse button to increase the lighting distance. It is also possible to position a light so far away that it can no longer be selected. In this case, the Reset button can be used to set all lights to their default positions.
Simulation»Material (Ctrl Alt M)
Activates the Material dialog, which can be used to define standard material visual properties. Material properties are saved by default in a materials.m3d file in the application data directory. Select the […] button to choose an alternate materials file. The following controls affect how material appears:
The Diffuse component is the color of the object.
The Ambient component is the color of light that indirectly strikes the object (for example, the color of the walls). For simplicity, the ambient component should be set to the same color as the diffuse component.
The Specular component is the color of the light given off by the main light source.
The Shininess slider determines how reflective the material’s surface is. A shiny object reflects more of the specular light component back to the viewer.
The Transparency slider can be used to set material properties for plastics and glass. Set “stock” components transparent to have an unobstructed view of the tool path trace.
The five material property values are assigned to each component when it is created or modified. The material name is also saved, for informational purposes only. Changing the properties of an existing material will not affect the model or any stock/fixture/part objects that have already been created. When displaying the material properties of a component, the material name will appear as “Custom” if the 5 properties cannot be exactly matched in the current materials file.
Simulation»Display (Ctrl Alt D)
Activates the Display dialog, which is used to change the HUD “heads-up” display settings. The heads-up display is a small status screen that floats above the simulation window. The position, content and appearance of the heads-up display are controlled from the Display dialog.
Individual layout schemes can be saved in the Windows Registry by selecting Save As and entering a name. Changes to the currently listed scheme (in the Scheme drop-down) are saved when OK is pressed. A scheme can be removed from the registry by selecting the name in the scheme drop-down and then selecting Delete. The “Default” scheme cannot be changed or deleted.
Select the Show Display checkbox to activate the heads-up display in the simulation window (Ctrl D does the same when the Display dialog is not active). Select the “Use default schemes in cycle” checkbox to include the Default display when using Ctrl D to cycle through each of the schemes in sequence. The following status information can appear in the heads-up display.
Tool number: The current tool ID or tool pocket number.
Machine axis: The linear and rotary axes.
Feedrate: The current feed interpolation rate or the keyword RAPID.
Motion type: A keyword describing the type of motion, e.g., LINEAR, CIRCULAR.
Active compensations: Fixture, length and diameter compensation settings.
Coolant: The current coolant status.
Spindle: The current spindle status and rpm.
Time: Elapsed machining time.
Channels: Current active channel and time.
Head number: The current head ID or head pocket number.
Operation name: The current operation name if defined in the program.
Extra spindles: Additional information about spindles.
Extra channels: Additional information about channels.
Extra axes: Additional axes in the model.
FPS: The simulation window display rate in the form “a / b”. The value “a” is the redraw speed in frames/second and is an indicator of graphic performance. The value “b” is actual screen updates/second and is an indicator of total model performance.
The Position input field specifies in which corner the heads-up display will appear. The text appearance is controlled by the Font, font Size, Bold, Italic and Text Color input fields. The heads-up display will appear directly over the simulation window contents. You can experiment with various frame background colors (BG Color) and vary the background opacity (BG Opacity) to obtain the best contrast.
Simulation»Chip and Split (Ctrl Alt C)
Activates the Simulation “Stock splitting management” dialog, which provides functions to segment the in-process stock into multiple independent pieces as well as to remove uncut in-process stock fragments from the simulation. This function is only available with a Material Removal Simulation (MRS) license.
When the dialog is activated, an analysis is performed of the in-process stock remaining in the simulation. Each separate stock object including all disconnected stock chips (i.e., fragments) that remain in the simulation are listed one per line in the dialog. Each is identified by a combination of part name, stock component name and chip number. The volume of each is also listed (the volume units are as defined in the Simulation»Options dialog MRS tab). Double-click on a column header to sort the data by that column. Double-click on the header again to reverse the sort order.
Stock chips selected in the dialog will be highlighted in the simulation window. Multiple stock chips can be selected in the dialog by using the Ctrl and Shift keys as normal. Pressing the “Remove selection” button will completely remove all selected stock chip from the simulation from the current time going forwards. Any stock chips that were removed will become visible only when moving Time Line backwards past the moment in time at which they were removed.
Stock chips can be automatically removed using the Simulation»Options dialog MRS tab “Automatic chip removal” settings. The post-processor or model developer can also programmatically remove disconnected stock chips via the Virtual Machine $FMSCHIP function.
Simulation»Compare (Ctrl Alt Q)
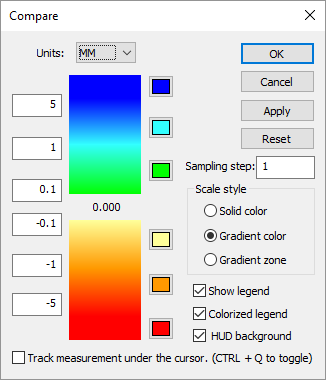
Activates the Simulation Compare dialog, which defines various settings used when comparing the in-process stock against the related part. This function is only available with a Material Removal Simulation (MRS) license.
The association between a part and its corresponding in-process stock is defined in the Simulation»Parts/ Fixtures dialog (see here).
The comparison colorization settings are applied only to gouge and excess material, which must first be enabled by selecting one or both of the Boolean Overcut and Boolean Undercut filters (see here).
The comparison is done by sampling the surface of the gouge and/or excess material and computing the shortest distance to the part. The distance is then used to assign a fixed or graduated color, as defined using
the various options of the Compare dialog. If the sample size is small, or the part very large, the colorization process may take a long time to compute. The comparison can be cancelled at any time, in which case the displayed results will be incomplete (but perhaps still useful).
The settings of note on the Compare dialog are:
Units: Specifies the units of measure for all numeric values in the dialog.
Sampling steps: Specifies the maximum distance along the surface between comparison measurements. Using a small value may greatly increase the computation time and complexity of the resulting colorized object.
Scale style: Defines how the excess and gouge distances will be colorized. Three excess and three gouge zones are available, at increasing offsets from the part. With the Solid color and Gradient color settings, each zone is represented by a single user definable color (using the color buttons to the right of the scale). With the Gradient zone setting, the inner two zones can individually be color graduated between two colors.
Track measurement…: If selected, the measured distance between stock and part under the cursor will be shown and dynamically updated as the cursor moves. You can also toggle this feature on and off using Ctrl Q.
Those surfaces on the colorized in-process stock that are neither gouged or excess will not be shown, unless the Simulation»Show»Filters»Transparent zero filter is enabled.
Simulation»Options (Ctrl Alt O)
Activates the Simulation Options dialog, which defines various settings used in the simulation. Options are organized by Time Line, Tool Path, MRS (i.e., material removal simulation), Tolerance and Miscellaneous tab pages.
Time Line Options
These options control the behavior, display and contents of the Time Line window.
Use Time Line animation when set causes the Time Line window to smoothly interpolate when changing the time-scale or when using F3, Shift F3 or the Synchronize feature to jump from one moment in time to another.
Use Time Line color label when set causes the Time Line window labels to be shown in various colors depending on the type of data. Clear this checkbox to have labels appear in a uniform high contrast color.
Include probe touch events in Time Line find affects the behavior of the F3 and Shift F3 search function in the Time Line window. When set, searching for collisions will stop at probe touch events. When the checkbox is cleared, probe events are ignored for search purposes.
Include start and end in Time Line find affects the behavior of the F3 and Shift F3 search function in the Time Line window. When set, searching forward past the last event of the type being searched will position to the end of the Time Line window; searching backwards before the first event will position to the start of the Time Line window. When the checkbox is cleared, attempts to search beyond the last (or before the first) event will result in no action.
Show tooltip in Time Line when set enables the display of tooltips, which describe events of interest under the cursor (e.g., collision, tool…). Tooltips identify the start and ending time of the event as well as other pertinent information.
Limit Time Line memory and its associated input field can be used to avoid out-of-memory conditions on very large programs. If set, the Time Line window will only use the specified amount of memory to track the events of the model. Once the limit has been reached, events earlier in the program will no longer be accessible via the Time Line window.
Default view size sets the minimum width (in minutes) of the Time Line display at the start of a new process.
The Show checkboxes list the types of information desired in the Time Line window. This can also be done in the Time Line window itself, using the right-mouse button context menu.
Color code controls define the color to use for the horizontal bars in the Time Line window. A “Use cut color” setting for Tools will use the same color in the Time Line as is used for material removal simulation on the in-process stock.
Tool Path Options
These options control the display of the tool path trace in the simulation window. The trace appears as a thin line, with different colors representing interpolation and positioning. Many of the tool path options can be also be controlled from the Tool Path toolbar.
Show tool path trace shows or hides tool-path tracing.
Show tool vector shows or hides tracing of the tool-axis vector when tool path tracing is active.
When the Use overlay checkbox is selected, the tool path trace will not be hidden by objects that might be between you (the viewer) and the tool path.
Tool tip and SCP trace settings selects whether the trace will be drawn at the tool tip or at the spindle control point (SCP). Tooling must have a length to see a difference between these traces. This setting has no effect on a tool path that is already drawn.
Mode settings select the extent of the tool path trace.
Up to current time: Traces the entire tool path from the start of the program.
seconds: Traces the tool path for the specified last number of seconds.
tool changes: Traces the tool path for the specified last number of tool changes.
operations: Traces the tool path for the specified last number of operations.
Tool path trace mode settings are also available from the VM Tool Path toolbar. Clear the 3 rightmost toggles to trace the entire tool path from the start of the program.
Motion style settings provide the ability to set the color, line style and line width of tool path traces for various types of motions.
Tool vector settings provide the ability to set the color, line style and line width of the tool axis vector trace.
MRS Options
These options provide control over the in-process stock; functionality that requires a Material Removal Simulation (MRS) license[3].
In-process stock checkpoints settings control the visualization of the in-process stock when moving Time Line backwards and forwards. If checkpoints are enabled and Simulation»Show»Filters»Stock Checkpoints is toggled on, then the in-process stock will update to show its state at earlier moments in time when moving Time Line backwards and forwards. The frequency of checkpoints can be controlled as follows:
At each tool change: Creates a checkpoint at every tool change.
At each operation: Creates a checkpoint at the start of every operation.
Periodically during long cutting sequences: Creates a checkpoint after the specified number of motions have been processed.
Flute length optimization settings control the analysis and reporting (in the listing file) of optimal tool flute lengths during the simulation.
ON: Enables flute length optimization.
OFF: Disables flute length optimization.
AUTO: Flute length optimization is under control of the ADAPTV/DEPTH command and of the $FMSADPT('DEPTH') macro function.
Extra body length: For ON only, specifies an extended flute length to use for analysis purposes. The maximum detectable flute length is the sum of the actual flute length and this value.
Automatic chip removal settings control the automatic removal of disconnected in-process stock chips (i.e., fragments) during the simulation.
Remove chips not intersecting the design: When the in-process stock is fragmented, independent fragments that do not intersect the part are removed.
Remove chips with volume less than: When the in-process stock is fragmented, independent fragments with a volume less than the specified amount are removed.
Plane offset step size sets the amount to offset the cross section plane when selecting Push Plane or Pull Plane on the Cross Section toolbar.
Tolerance Options
Define tolerance using specifies the units of measure for all tolerance values listed.
Gouge tolerance specifies an acceptable collision tolerance between the cutting portion of the tool and the part model. Some gouging is to be expected, which is normally a function of the manufacturing tolerance used by the CAM system. When the Material Removal Simulation (MRS) license option is enabled, the gouge tolerance also defines the cutting tolerance to use when computing the in-process stock. The actual cutting tolerance used is a function of the gouge tolerance and tool usage (see tool “Usage” description).
Collision tolerance specifies the accuracy in space of the beginning and end of a collision event between two objects.
Faceting tolerance specifies the accuracy of mesh objects generated at run-time from swept profiles. A tighter tolerance produces more accurate results, but at the cost of increased memory and CPU. One of the key uses of the faceting tolerance is in the generation of 3D tooling given either a 2D profile or tool definition parameters (i.e., diameter, corner radius, length…).
Tool path resolution defines the tolerance to use when approximating curved motions by short straight-line segments.
Miscellaneous Options
Rendering settings affect the simulation graphic quality. This has no effect on collision and overtravel checking. The settings are dependent upon the computer’s GPU.
Animation control settings affect the simulation display speed.
Continuous: Select this method to slow the simulation down to some Scale factor of real time (within the limitations of the CPU and graphics capabilities of your computer). Select Motion Step during Tool Change to speed up the animation of tool changes.
Motion Step: Select this method to update the Virtual Machine window at the endpoint of every Step Size motions.
Time Interval: Select this method to only update the Virtual Machine window at a set Interval in seconds. This method has the least impact in terms of CPU requirements.
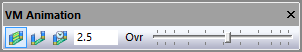
Animation control settings are also available from the VM Animation toolbar. When in continuous animation mode, extremely slow motions may give the impression that the software is no longer operating. If unsure, activate the HUD motion display, which will show if axes are in fact moving. Animation control settings can be changed while the simulation is running (and even mid interpolation).
World background color setting control the underlying color of all simulation windows.
Use gradient can be selected to use a two-color smooth gradient background.
Top defines the background color if gradient fill is not selected, or the color to use at the upper edge of the simulation windows when using a gradient fill background.
Bottom defines the color to use at the lower edge of the simulation windows when using a gradient fill background.
Backface settings control how the backside of a surface should be shown. VM uses a mesh of triangles to represent objects. Each triangle has a concept of in and out, which is used in the drawing process to correctly color and shade the triangle. When an object is viewed from the inside looking out, VM provides the following choices on how the backside surface should be displayed:
Wireframe: An object’s surface will be drawn in wireframe mode when viewed from the inside. This setting may result in faint lines appearing at the edges of objects. Some graphic cards exhibit poor performance in this mode.
Solid: An object’s surface will be drawn as a solid when viewed from the inside (this setting is only valid when not in Simulation»Show»Wireframe mode).
Hidden: An object’s surface will be hidden when viewed from the inside.
Miscellaneous settings include the following:
Use 3D construction positioning controls the operation of the left-mouse button when constructing objects. When set, it takes two mouse clicks to define a point in space: the first defines the XY location and the second defines the Z. When the 3D checkbox is clear, the first mouse-click defines the XYZ coordinates.
Default to Look-Around camera sets the default mode of camera rotation. When set, camera rotation by default rotates around the current camera position (like turning your head) and the Shift key must be pressed to rotate around a point in space in front of the camera. When this checkbox is clear, the default is the reverse. The camera will rotate around a point in space in front of the camera and the Shift key will cause the camera to rotate around the current position.
Use camera animation when set causes the camera to smoothly interpolate between any two user-defined viewpoints sharing the same type (i.e., perspective vs. orthogonal). When this checkbox is cleared, the camera jumps directly to each new viewpoint.
Default to Camera mode sets the default functionality of the left-mouse button. When set, the default is “Camera” mode; meaning that the left-mouse button controls the orientation of the camera and the Ctrl key must be held down to select objects. When this checkbox is clear, the default is “Selection” mode; meaning that the left-mouse button is used to select objects and the Ctrl key must be held down to orient the camera. The Camera and Selection mode defaults can also be set using the camera and pointer buttons on the VM Mode toolbar.
Enable $FMSCMRA and CAMERA pp command when set allows the active simulation window viewpoint to be changed under program control, using the CAMERA post-processor command (GENER only) or the Virtual Machine $FMSCMRA macro function. Clear this checkbox to inhibit viewpoint changes under program control.
Show collision interference when set will dynamically show, as a yellow line, the intersection between colliding objects. Computing the intersection takes considerably more CPU than simply detecting if a collision has occurred. You can disable the viewing of collision interference if you encounter unacceptable performance with colliding objects on complex scenes.
The Video Options button calls up a Video Compression dialog listing the various Compressor methods that can be used for recording the contents of the active simulation window when selecting the Simulation»Annotation»Record menu function. These compressor methods, called “codecs” (short for compressor/decompressor), use various techniques to reduce the size of the final recording file. Links to a selection of codecs that have been tested by the ICAM Support team can be found on the customer portal section of the ICAM web site.
Mouse Scheme overrides Virtual Machine’s default selection, panning, rotation and zoom features (called “ICAM Classic”) and uses instead the mouse and keyboard controls of the selected CAM system. The “ICAM 3DM” scheme is designed for use with a 3D mouse, providing unrestricted part rotation
Simulation»Open Setup
Activates a standard file dialog to select the name of the Verification Setup (.vsw) file to use for simulation. The setup file contains settings for lighting, grid, camera, viewpoints, etc. The setup file also contains a reference to a similarly named 3D Model (.m3d) file, which contains the part, stock and fixture definitions. Typically, each NC program input file will have an associated setup and 3D model file.
Simulation»Save Setup
Activates a standard file dialog to save the current simulation settings. Simulation settings are saved in the Verification Setup (.vsw) and 3D Model (.m3d) files.